
Proxying Out of the Box: A Comparative Analysis of HAProxy, Envoy, Nginx, Caddy, and Traefik
Hi everyone! I’m Stas, a tech lead at Mish Product Lab. This topic didn’t come out of nowhere, we’ve had plenty of debates inside the team about which proxy and SSL termination tool performs best in different scenarios. At first, our assumptions were based mostly on personal preference rather than data. After a few rounds of arguing (and hoping our favorite tools would win), we realized there was only one way to get an objective answer: run the tests ourselves.
Test Setup
To make our testing as objective as possible, we used three dedicated environments, each responsible for its own part of the load scenario. This separation minimized interference and helped us capture accurate performance data for every proxy tool.
All test systems were hosted within the same network — ensuring stable and predictable connectivity without major latency. No kernel tweaks, just clean systems.
- Test Stand 1 (K6): Used for traffic generation and load management with K6. Resources: 32 vCPU, 128 GB RAM — enough to push real stress without becoming the bottleneck.
- Test Stand 2 (Web): The main test target. This environment hosted all proxy tools — HAProxy, Envoy, Nginx, Caddy, and Traefik — with built-in monitoring from the hosting provider. Resources: 32 vCPU, 128 GB RAM.
- Test Stand 3 (Backend): A simple Golang backend service used to receive and process proxy requests. Resources: 8 vCPU, 32 GB RAM.
This setup gave us clean, unbiased results across all tools.
Web Server Versions
- haproxy 3.1.6
- envoy 1.34.0-dev
- nginx 1.27.4
- traeffik 3.3.5
- caddy 2.9.1
Backend Configuration
The backend service was built in Golang using fasthttp — no extra layers.
package main

import (
        "fmt"
        "log"

        "github.com/valyala/fasthttp"
)

func main() {
        fmt.Println("Listening on :8080")
        requestHandler := func(ctx *fasthttp.RequestCtx) {
                switch string(ctx.Path()) {
                case "/":
                        handleRoot(ctx)
                default:
                        ctx.Error("Unsupported path", fasthttp.StatusNotFound)
                }
        }

        if err := fasthttp.ListenAndServe(":8080", requestHandler); err != nil {
                log.Fatalf("Error in ListenAndServe: %s", err)
        }
}

func handleRoot(ctx *fasthttp.RequestCtx) {
        ctx.SetStatusCode(fasthttp.StatusOK)
        ctx.SetBodyString("hello world")
}
Baseline stress test: 50,000 RPS, 1-minute K6 run (traffic generation + response verification)
import http from 'k6/http';
import { check } from 'k6';

export let options = {
  scenarios: {
    constant_request_rate: {
      executor: 'constant-arrival-rate',
      rate: 50000,
      timeUnit: '1s',
      duration: '60s',
      preAllocatedVUs: 1000,
      maxVUs: 100000,
    },
  },
};

export default function () {
  let res = http.get('http://10.0.0.8:8080');

  check(res, {
    'status is 200': (r) => r.status === 200,
    'body contains expected content': (r) => typeof r.body === 'string' && r.body.includes('hello world'),
  });
}
scenarios: (100.00%) 1 scenario, 100000 max VUs, 1m30s max duration (incl. graceful stop):
         * constant_request_rate: 50000.00 iterations/s for 1m0s (maxVUs: 1000-100000, gracefulStop: 30s)

  █ THRESHOLDS

    checks
    ✓ 'rate>=0.95' rate=100.00%

    http_req_duration
    ✓ 'p(95)<500' p(95)=387.29µs

    http_req_failed
    ✓ 'rate<0.01' rate=0.00%

  █ TOTAL RESULTS

    checks_total.......................: 5993052 99880.644605/s
    checks_succeeded...................: 100.00% 5993052 out of 5993052
    checks_failed......................: 0.00%   0 out of 5993052

    ✓ status is 200
    ✓ body contains expected content

    HTTP
    http_req_duration.......................................................: avg=283.17µs min=110.92µs med=234.52µs max=235.41ms p(90)=324.36µs p(95)=387.29µs
      { expected_response:true }............................................: avg=283.17µs min=110.92µs med=234.52µs max=235.41ms p(90)=324.36µs p(95)=387.29µs
    http_req_failed.........................................................: 0.00%   0 out of 2996526
    http_reqs...............................................................: 2996526 49940.322303/s

    EXECUTION
    dropped_iterations......................................................: 3476    57.931271/s
    iteration_duration......................................................: avg=349.05µs min=142.88µs med=277.87µs max=1.06s    p(90)=374.7µs  p(95)=453.85µs
    iterations..............................................................: 2996526 49940.322303/s
    vus.....................................................................: 15      min=10           max=183
    vus_max.................................................................: 1044    min=1044         max=1044

    NETWORK
    data_received...........................................................: 438 MB  7.3 MB/s
    data_sent...............................................................: 246 MB  4.1 MB/s
Results: Test passed successfully.
Max latency: 47.52 ms
Throughput: 49,964 RPS
Proxy Configuration and Testing
K6 (traffic generation and response verification, HTTP code and body):
import http from 'k6/http';
import { check } from 'k6';

export let options = {
  scenarios: {
    constant_request_rate: {
      executor: 'constant-arrival-rate',
      rate: 50000,               // number of requests per second
      timeUnit: '1s',            // time unit for rate
      duration: '60s',           // test duration
      preAllocatedVUs: 1000,     // number of pre-allocated virtual users
      maxVUs: 100000,            // maximum number of VUs that can be used
    },
  },
  thresholds: {
    checks: ['rate>=0.95'],
    http_req_failed: ['rate<0.01'],
    http_req_duration: ['p(95)<500'],
  },
};

export default function () {
  let res = http.get('https://test-backend.mish.design');

  check(res, {
    'status is 200': (r) => r.status === 200,
    'body contains expected content': (r) => typeof r.body === 'string' && r.body.includes('hello world'),
  });
}
Get the certificate:
sudo apt install certbot
sudo certbot certonly --standalone -d test-backend.mish.design
The certificates will appear here:
/etc/letsencrypt/live/test-backend.mish.design/fullchain.pem
/etc/letsencrypt/live/test-backend.mish.design/privkey.pem;
Now let's combine them, that’s necessary for HAProxy:
cd /etc/letsencrypt/live/test-backend.mish.design/
cat fullchain.pem privkey.pem > haproxy.pem
HAProxy
We started with HAProxy — a classic for fast and reliable benchmarking with minimal configuration overhead.
docker-compose.yml
- HAProxy is deployed via Docker Compose, which makes it easy to reproduce the environment on different servers and developers' machines.
- Ports 80 and 443 are forwarded outwards, meaning that the service is clearly focused on processing HTTP and HTTPS requests.
- The Let's Encrypt SSL certificate is connected directly via volume, so the service is immediately ready to work in secure mode (HTTPS).
;services:
  haproxy:
    image: haproxy:latest
    container_name: haproxy
    ports:
      - "80:80"
      - "443:443"
    volumes:
      - ./haproxy.cfg:/usr/local/etc/haproxy/haproxy.cfg:ro
      - /etc/letsencrypt/live/test-backend.mish.design/haproxy.pem:/usr/local/etc/haproxy/certs/haproxy.pem:ro
haproxy.cfg
All HTTPS traffic (port 443) is routed to the backend service at 10.0.0.8:8080.
defaults
    mode http

frontend main
    bind *:443 ssl crt /usr/local/etc/haproxy/certs/haproxy.pem
    default_backend test_backend

backend test_backend
    server test_backend_server 10.0.0.8:8080 check
Run the script/p>
scenarios: (100.00%) 1 scenario, 100000 max VUs, 1m30s max duration (incl. graceful stop):
         * constant_request_rate: 50000.00 iterations/s for 1m0s (maxVUs: 1000-100000, gracefulStop: 30s)

  █ THRESHOLDS

    checks
    ✓ 'rate>=0.95' rate=100.00%

    http_req_duration
    ✓ 'p(95)<500' p(95)=1.16ms

    http_req_failed
    ✓ 'rate<0.01' rate=0.00%

  █ TOTAL RESULTS

    checks_total.......................: 5967620 99455.517508/s
    checks_succeeded...................: 100.00% 5967620 out of 5967620
    checks_failed......................: 0.00%   0 out of 5967620

    ✓ status is 200
    ✓ body contains expected content

    HTTP
    http_req_duration.......................................................: avg=759.38µs min=330.64µs med=571.94µs max=1.07s p(90)=861.18µs p(95)=1.16ms
      { expected_response:true }............................................: avg=759.38µs min=330.64µs med=571.94µs max=1.07s p(90)=861.18µs p(95)=1.16ms
    http_req_failed.........................................................: 0.00%   0 out of 2983810
    http_reqs...............................................................: 2983810 49727.758754/s

    EXECUTION
    dropped_iterations......................................................: 16192   269.8536/s
    iteration_duration......................................................: avg=984.55µs min=360.44µs med=643.34µs max=1.36s p(90)=968.37µs p(95)=1.35ms
    iterations..............................................................: 2983810 49727.758754/s
    vus.....................................................................: 34      min=28           max=357
    vus_max.................................................................: 1293    min=1293         max=1293

    NETWORK
    data_received...........................................................: 374 MB  6.2 MB/s
    data_sent...............................................................: 108 MB  1.8 MB/s
System load
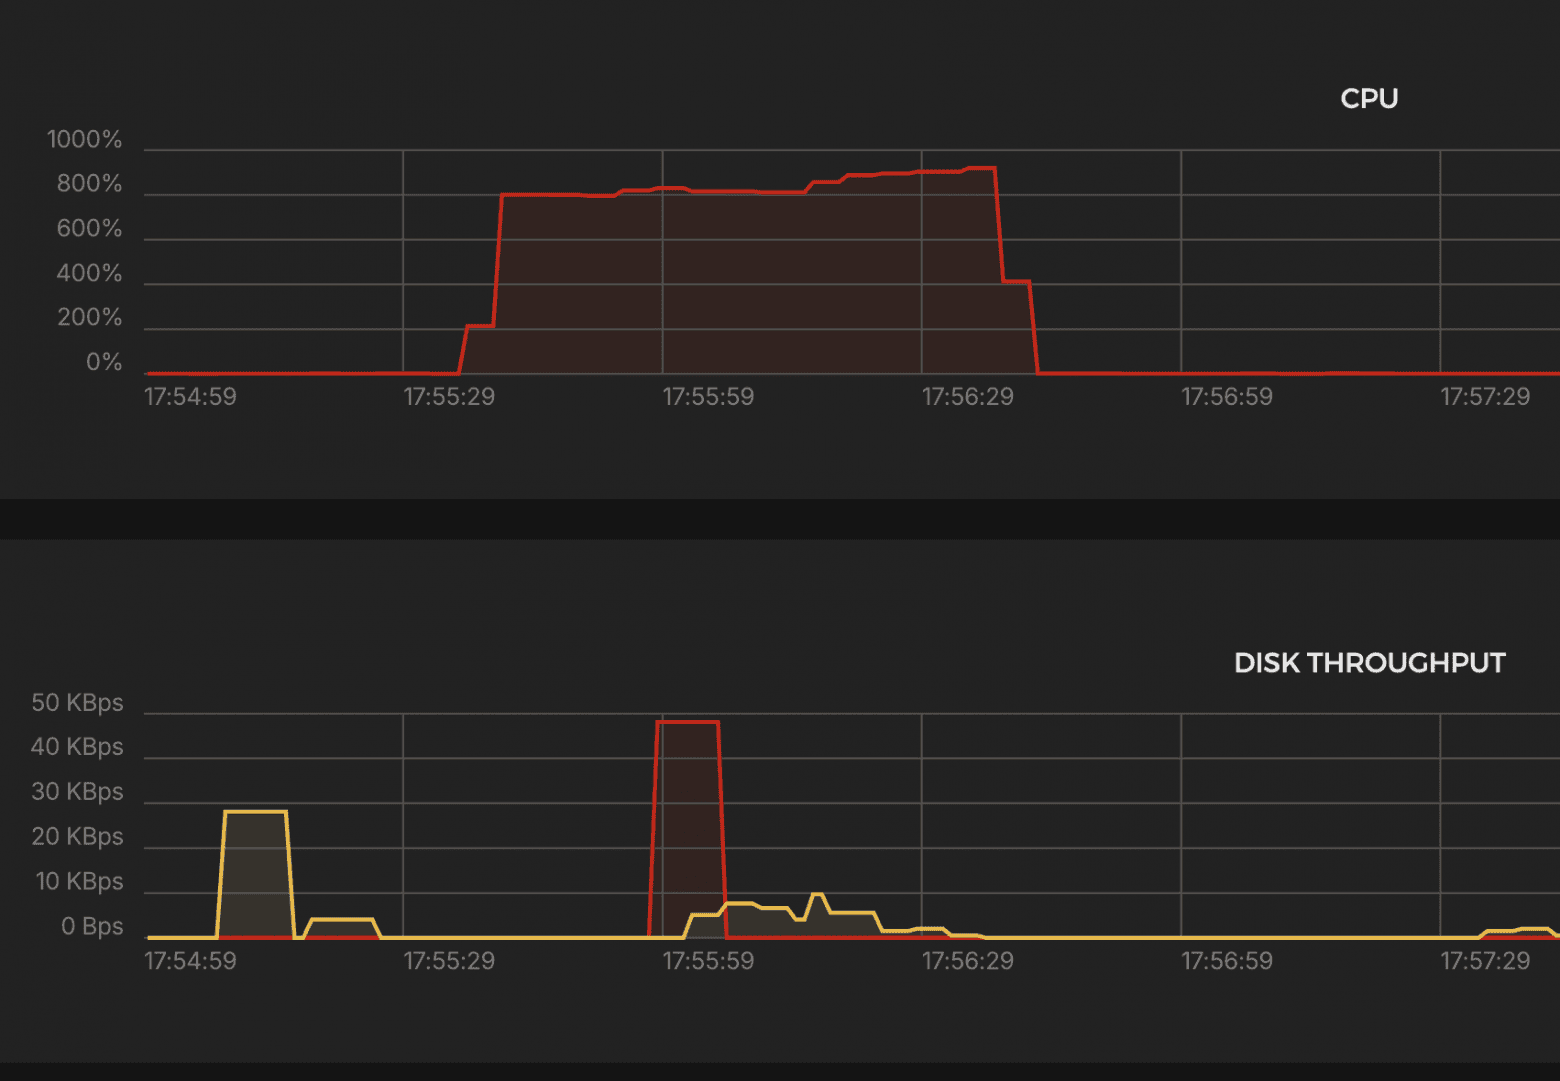
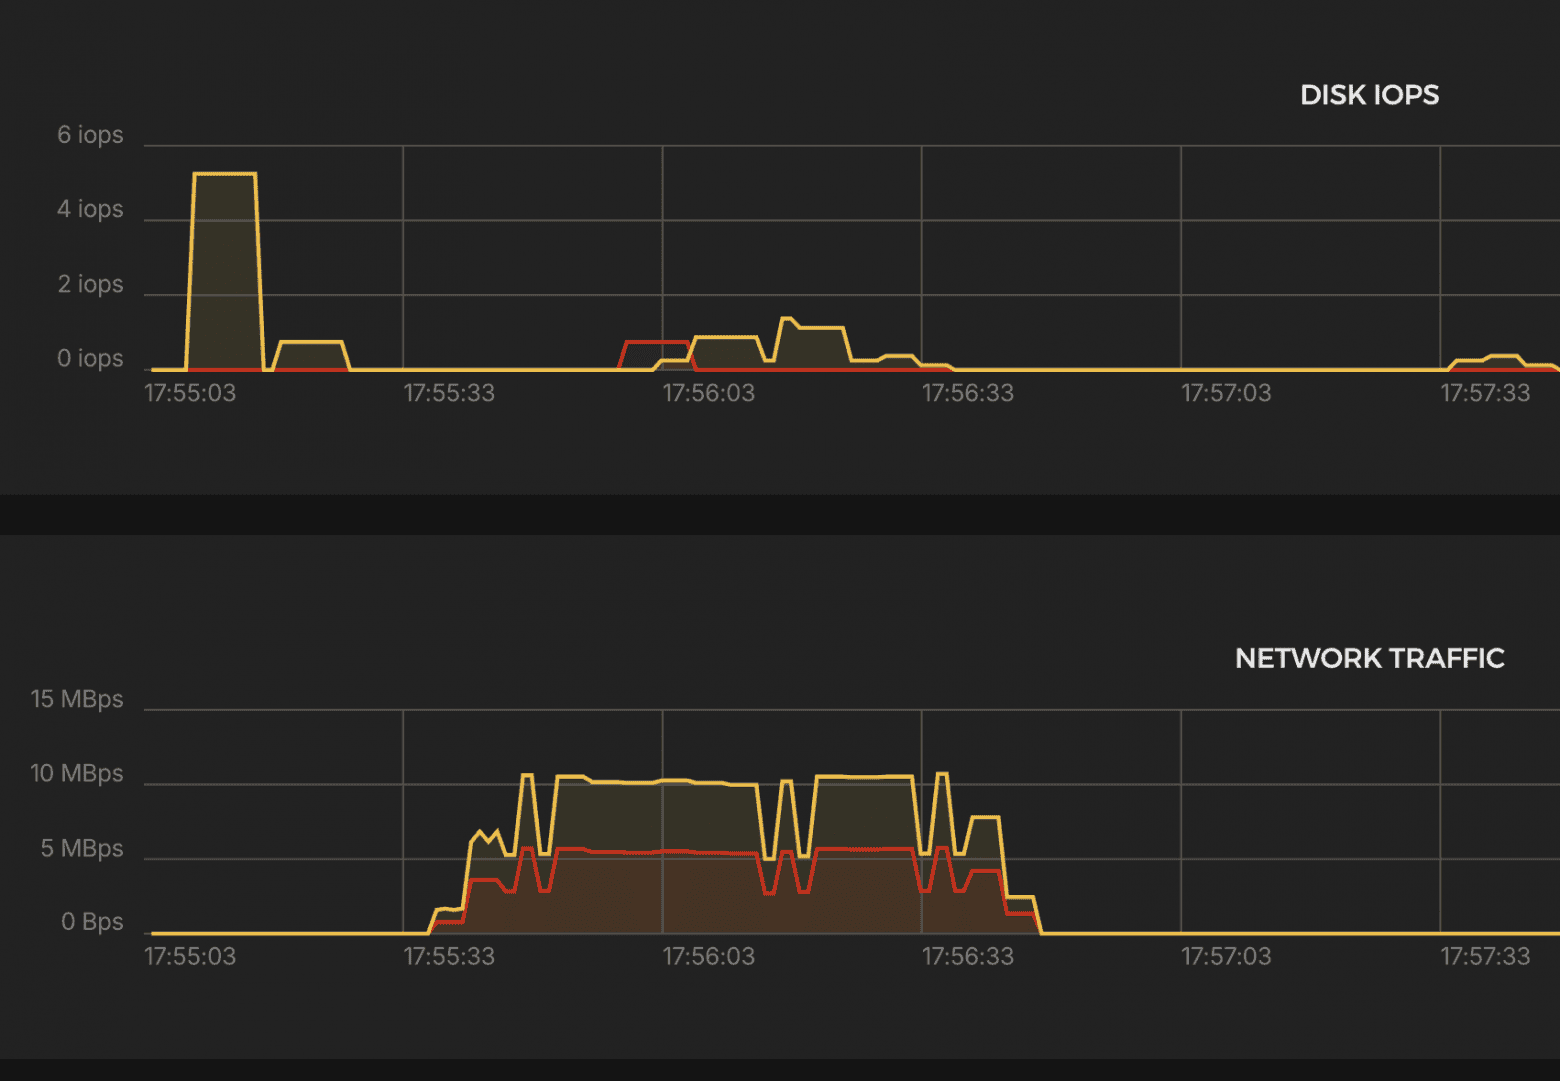
Results:
CPU
- ~900% (9 cores) → stable throughout the test
K6 Test Summary
- RPS (successful): 49,728 / sec
- Errors: 0% (http_req_failed = 0.00%)
- Dropped iterations: 16,192 (≈0.5%)
- Response time p(95): 1.16 ms
- Max. delay: 1.07s
- Data volume: Received: 374 MB (6.2 MB/s) Sent: 108 MB (1.8 MB/s)
- VUs used: 28–357
- Max. allowed: 1293 VUs
Excellent performance. Minimal latency. Rock-solid stability.
Envoy
A high-performance proxy and load balancer from Lyft with dynamic configuration, observability, and modern protocol support.
docker-compose.yml
- Envoy is deployed via Docker Compose for easy environment reproducibility.
- Ports 80 and 443 are opened to handle incoming traffic.
- A Let’s Encrypt certificate is used, directly connected to the configuration.
services:
  envoy:
    image: envoyproxy/envoy-dev:latest
    container_name: envoy
    environment:
     - "ENVOY_UID=0"
    volumes:
     - /etc/letsencrypt:/etc/certs:ro
     - ./envoy.yaml:/etc/envoy/envoy.yaml
    ports:
     - "80:80"
     - "443:443"
envoy.yaml
- Requests coming to the domain test-backend.mish.design are redirected to the backend service at 10.0.0.4:8080 with round-robin load balancing.
- Envoy automatically terminates TLS connections and routes traffic over HTTP.
static_resources:
  secrets:
    - name: server_cert
      tls_certificate:
        certificate_chain:
          filename: /etc/certs/live/test-backend.mish.design/fullchain.pem
        private_key:
          filename: /etc/certs/live/test-backend.mish.design/privkey.pem

  listeners:
  - name: back_listener
    address:
      socket_address:
        address: 0.0.0.0
        port_value: 443
    filter_chains:
    - filters:
      - name: envoy.filters.network.http_connection_manager
        typed_config:
          "@type": type.googleapis.com/envoy.extensions.filters.network.http_connection_manager.v3.HttpConnectionManager
          codec_type: AUTO
          stat_prefix: ingress_http
          upgrade_configs:
          - upgrade_type: websocket
          route_config:
            name: local_route
            virtual_hosts:
            - name: main
              domains:
              - "test-backend.mish.design"
              routes:
              - match:
                  prefix: "/"
                route:
                  cluster: back
          http_filters:
          - name: envoy.filters.http.router
            typed_config:
              "@type": type.googleapis.com/envoy.extensions.filters.http.router.v3.Router

      transport_socket:
        name: envoy.transport_sockets.tls
        typed_config:
          "@type": type.googleapis.com/envoy.extensions.transport_sockets.tls.v3.DownstreamTlsContext
          common_tls_context:
            tls_certificate_sds_secret_configs:
             - name: server_cert

  clusters:
  - name: back
    connect_timeout: 5s
    type: STRICT_DNS
    lb_policy: ROUND_ROBIN
    load_assignment:
      cluster_name: back
      endpoints:
      - lb_endpoints:
        - endpoint:
            address:
              socket_address:
                address: 10.0.0.4
                port_value: 8080
Run the script
scenarios: (100.00%) 1 scenario, 100000 max VUs, 1m30s max duration (incl. graceful stop):
         * constant_request_rate: 50000.00 iterations/s for 1m0s (maxVUs: 1000-100000, gracefulStop: 30s)

  █ THRESHOLDS

    checks
    ✓ 'rate>=0.95' rate=100.00%

    http_req_duration
    ✓ 'p(95)<500' p(95)=3.34ms

    http_req_failed
    ✓ 'rate<0.01' rate=0.00%

  █ TOTAL RESULTS

    checks_total.......................: 5970208 99497.954679/s
    checks_succeeded...................: 100.00% 5970208 out of 5970208
    checks_failed......................: 0.00%   0 out of 5970208

    ✓ status is 200
    ✓ body contains expected content

    HTTP
    http_req_duration.......................................................: avg=1.38ms min=421.73µs med=1ms    max=131.98ms p(90)=2.11ms p(95)=3.34ms
      { expected_response:true }............................................: avg=1.38ms min=421.73µs med=1ms    max=131.98ms p(90)=2.11ms p(95)=3.34ms
    http_req_failed.........................................................: 0.00%   0 out of 2985104
    http_reqs...............................................................: 2985104 49748.977339/s

    EXECUTION
    dropped_iterations......................................................: 14895   248.236248/s
    iteration_duration......................................................: avg=1.63ms min=454.49µs med=1.08ms max=1.15s    p(90)=2.33ms p(95)=3.87ms
    iterations..............................................................: 2985104 49748.977339/s
    vus.....................................................................: 59      min=49           max=291
    vus_max.................................................................: 1262    min=1246         max=1262

    NETWORK
    data_received...........................................................: 597 MB  9.9 MB/s
    data_sent...............................................................: 344 MB  5.7 MB/s
System load
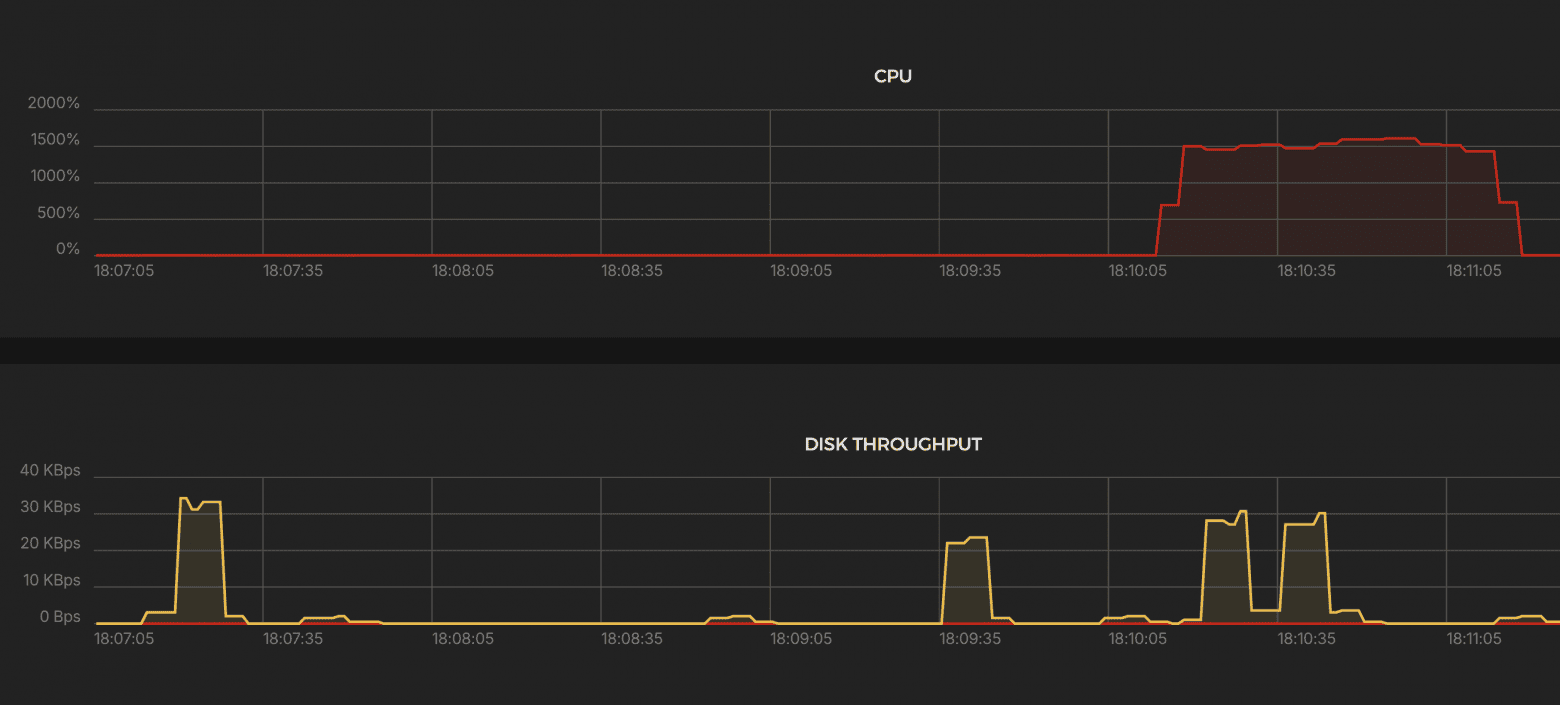
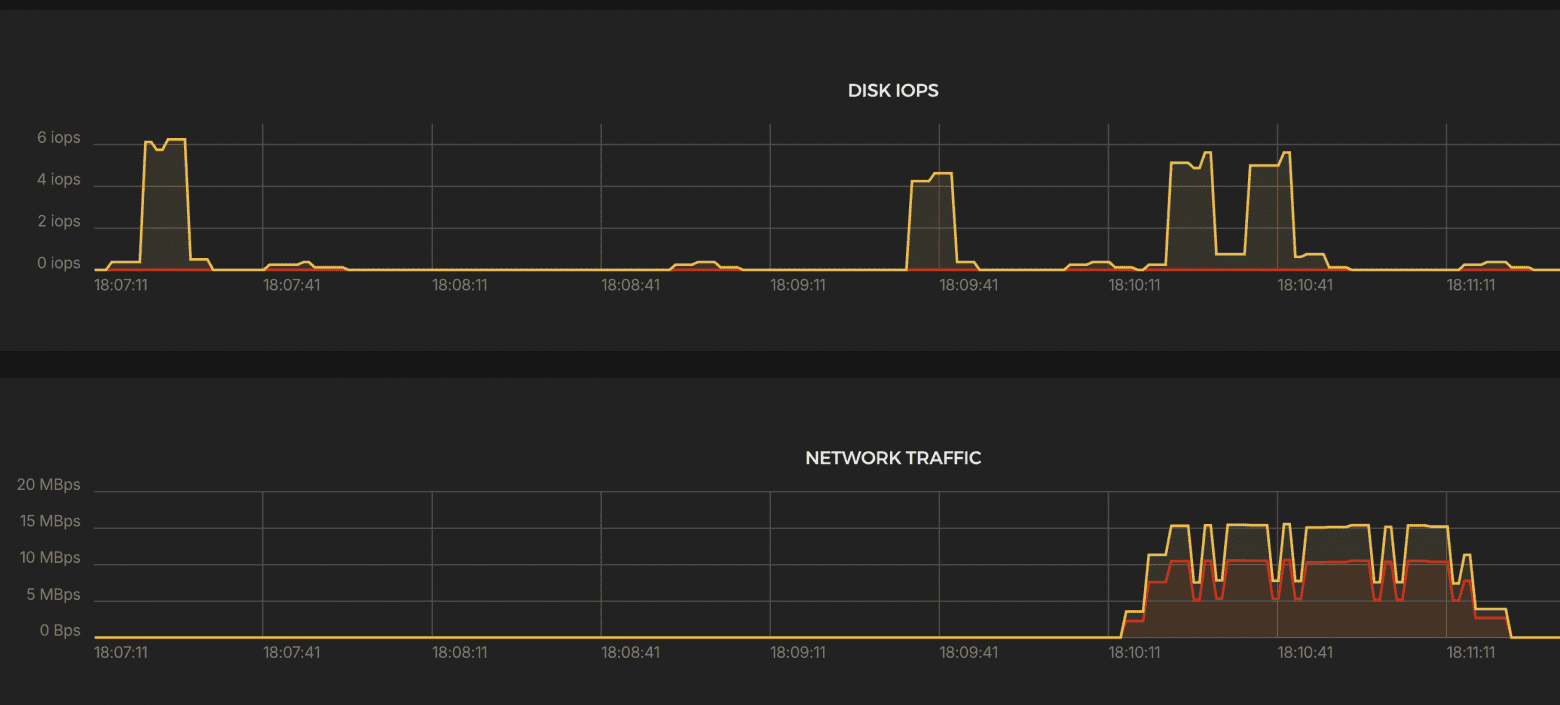
Results:
CPU
- ~1600% → up to 16 cores used, remained stable.
K6 Test Summary
- RPS (successful): 49,749 / sec
- Errors: 0%
- Dropped iterations: 14,895 (≈0.5%)
- Response time p(95): 3.34 ms
- Max. latency: 132 ms
- Data volume: Received: 597 MB (9.9 MB/s) Sent: 344 MB (5.7 MB/s)
- VUs used: 49–291
- Max. allowed: 1262 VUs
Outstanding performance — nearly identical to HAProxy, slightly higher CPU load.
Traefik
A modern reverse proxy and load balancer designed for containerized environments like Docker and Kubernetes. Supports automatic SSL via Let’s Encrypt.
docker-compose.yml
- Running via Docker Compose — Traefik runs as a separate service in a container.
- Ports 80 and 443 — open for receiving HTTP and HTTPS traffic.
- Let’s Encrypt certificates — fully automatic issuance and storage of certificates.
services:
  traefik:
    image: traefik:latest
    container_name: traefik
    ports:
      - "80:80"
      - "443:443"
    volumes:
      - /var/run/docker.sock:/var/run/docker.sock
      - ./traefik_data:/etc/traefik
      - ./traefik_data/dynamic_conf.yml:/etc/traefik/dynamic_conf.yml
    command:
      - "--log.level=ERROR"
      - "--accesslog=false"
      - "--api.dashboard=false"
      - "--providers.docker=true"
      - "--providers.docker.exposedbydefault=false"
      - "--providers.file.filename=/etc/traefik/dynamic_conf.yml"
      - "--entrypoints.web.address=:80"
      - "--entrypoints.websecure.address=:443"
      - "--certificatesresolvers.myresolver.acme.httpchallenge=true"
      - "--certificatesresolvers.myresolver.acme.httpchallenge.entrypoint=web"
      - "--certificatesresolvers.myresolver.acme.email=example@yandex.com"
      - "--certificatesresolvers.myresolver.acme.storage=/etc/traefik/acme.json"
dynamic_conf.yml
- Requests to test-backend.mish.design via HTTPS go to the backend service at http://10.0.0.8:8080.
- The entryPoint websecure (port 443) is used.
- Load balancing is performed at the Traefik level.
http:
  routers:
    myrouter:
      rule: "Host(`test-backend.mish.design`)"
      entryPoints:
        - websecure
      tls:
        certResolver: myresolver
      service: myservice

  services:
    myservice:
      loadBalancer:
        servers:
          - url: "http://10.0.0.4:8080"
Run the script
scenarios: (100.00%) 1 scenario, 100000 max VUs, 1m30s max duration (incl. graceful stop):
         * constant_request_rate: 50000.00 iterations/s for 1m0s (maxVUs: 1000-100000, gracefulStop: 30s)

  █ THRESHOLDS

    checks
    ✗ 'rate>=0.95' rate=67.15%

    http_req_duration
    ✗ 'p(95)<500' p(95)=8.46s

    http_req_failed
    ✗ 'rate<0.01' rate=32.84%

  █ TOTAL RESULTS

    checks_total.......................: 723606 9317.72162/s
    checks_succeeded...................: 67.15% 485906 out of 723606
    checks_failed......................: 32.84% 237700 out of 723606

    ✗ status is 200
      ↳  67% — ✓ 242953 / ✗ 118850
    ✗ body contains expected content
      ↳  67% — ✓ 242953 / ✗ 118850

    HTTP
    http_req_duration.......................................................: avg=2.11s min=0s       med=70.12ms  max=32.98s p(90)=6.25s  p(95)=8.46s
      { expected_response:true }............................................: avg=2.47s min=622.32µs med=289.6ms  max=32.98s p(90)=6.68s  p(95)=9.22s
    http_req_failed.........................................................: 32.84%  118850 out of 361803
    http_reqs...............................................................: 361803  4658.86081/s

    EXECUTION
    dropped_iterations......................................................: 2088749 26896.379681/s
    iteration_duration......................................................: avg=4.42s min=1.1ms    med=358.05ms max=1m0s   p(90)=10.28s p(95)=27.16s
    iterations..............................................................: 361803  4658.86081/s
    vus.....................................................................: 26      min=26               max=29182
    vus_max.................................................................: 29243   min=2532             max=29243

    NETWORK
    data_received...........................................................: 126 MB  1.6 MB/s
    data_sent...............................................................: 24 MB   308 kB/s
System load
Results:
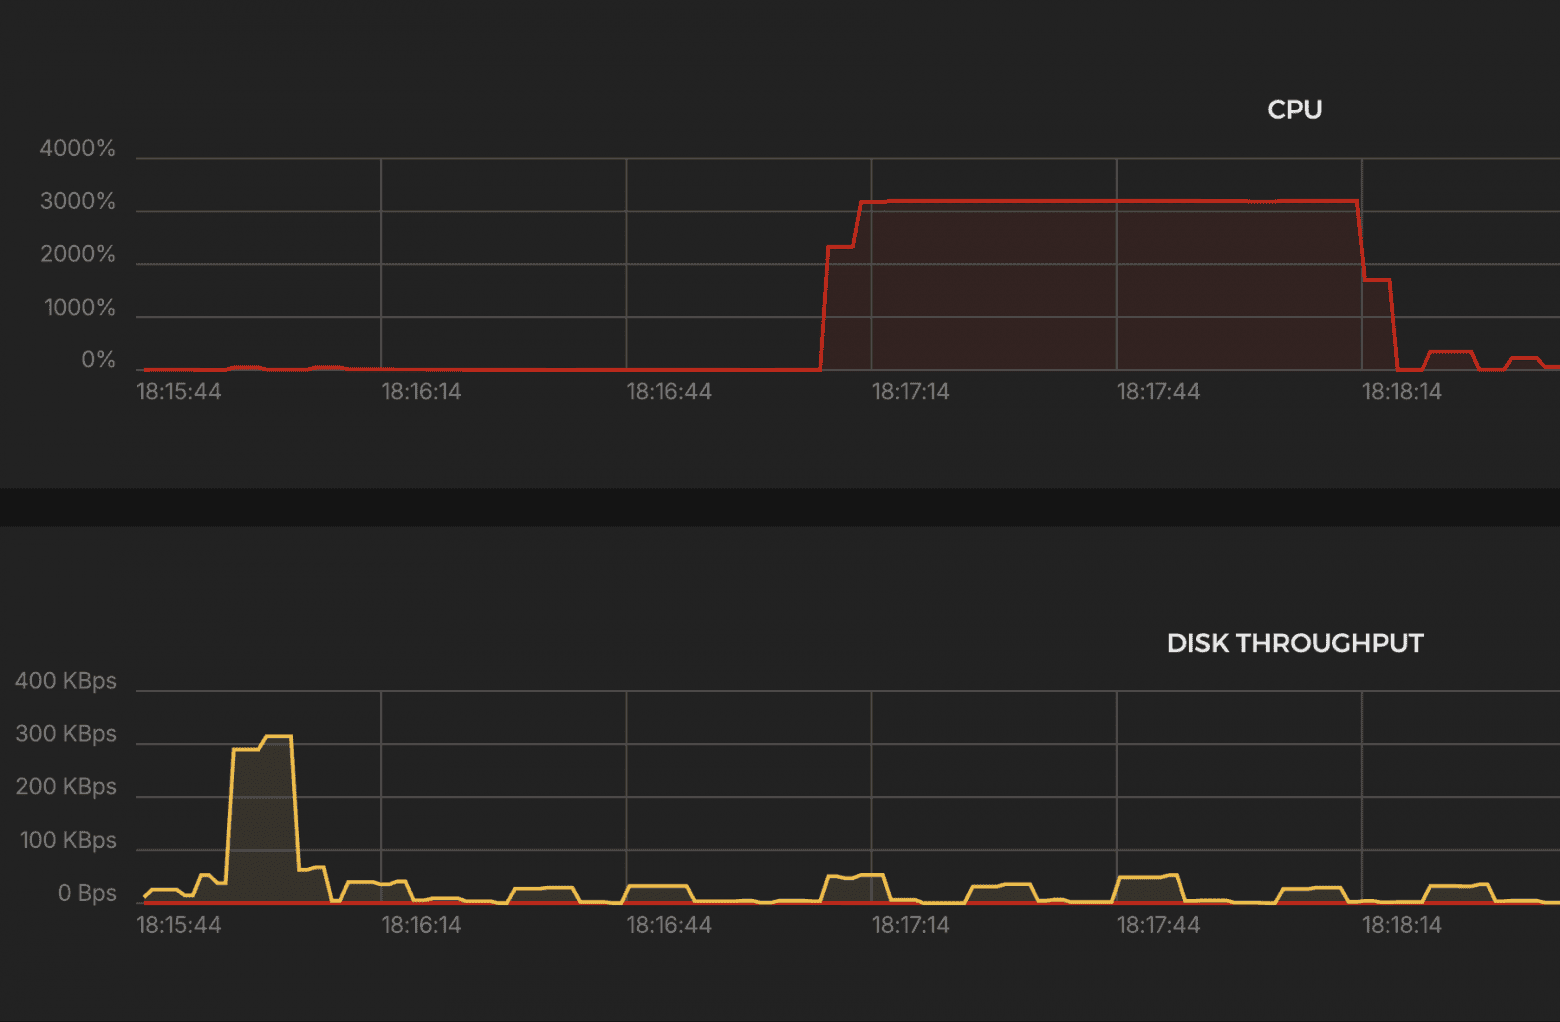
CPU
- ~3000% → ~30 cores engaged
Network Traffic
- Periods of downtime due to errors and drops.
K6 Test Summary
- Successful requests: 4,659 RPS (10 times lower than target)
- Errors: 32.84%
- Drops: 2,088,749 iterations (huge failure rate)
- p(95) response: 8.46 sec
- Maximum delay: 32.98 sec (!)
- Transferred: Received: 126 MB (1.6 MB/s) Sent: 24 MB (308 KB/s)
- VUs: up to 29,243 → increase in VUs indicates severe degradation under load
Verdict:
- Failed under 50k RPS.
- Massive drops and delays.
- Optimization is required, or it is not suitable for this level of load in the current configuration.
Nginx
A classic web server and reverse proxy known for its stability, high performance, and minimal resource consumption. One of the most popular tools for TLS termination, load balancing, and traffic proxying.
docker-compose.yml
- Running via Docker Compose — the NGINX container deploys quickly and conveniently.
- Ports 80 (HTTP) and 443 (HTTPS) are open for processing incoming traffic.
- Certificates from Let’s Encrypt are connected to ensure HTTPS.
services:
  nginx:
    image: nginx:latest
    volumes:
      - ./default.conf:/etc/nginx/nginx.conf
      - /etc/letsencrypt/live/test-backend.mish.design/fullchain.pem:/etc/letsencrypt/live/test-backend.mish.design/fullchain.pem:ro
      - /etc/letsencrypt/live/test-backend.mish.design/privkey.pem:/etc/letsencrypt/live/test-backend.mish.design/privkey.pem:ro
    ports:
      - "80:80"
      - "443:443"
default.conf
- All the main headers are specified for the correct transmission of the original IP and client scheme to the backend.
- worker_processes auto; — the number of workers is adjusted to the available cores.
- worker_rlimit_nofile 100000; — the limit on the number of open files is increased (important for high loads).
- worker_connections 5000; and multi_accept on; — designed for a large number of simultaneous connections.
- Epoll is used — an efficient mode for Linux systems with a high number of connections.
worker_processes auto;
worker_rlimit_nofile 300000;

events {
    worker_connections 5000;
    multi_accept on;
    use epoll;
}

http {
  server {
    listen 443 ssl;
    server_name test-backend.mish.design;

    ssl_certificate /etc/letsencrypt/live/test-backend.mish.design/fullchain.pem;
    ssl_certificate_key /etc/letsencrypt/live/test-backend.mish.design/privkey.pem;

    location / {
        proxy_pass http://10.0.0.4:8080;
        proxy_set_header Host $host;
        proxy_set_header X-Real-IP $remote_addr;
        proxy_set_header X-Forwarded-For $proxy_add_x_forwarded_for;
        proxy_set_header X-Forwarded-Proto $scheme;
    }
  }
}
Run the script
scenarios: (100.00%) 1 scenario, 100000 max VUs, 1m30s max duration (incl. graceful stop):
         * constant_request_rate: 50000.00 iterations/s for 1m0s (maxVUs: 1000-100000, gracefulStop: 30s)

  █ THRESHOLDS

    checks
    ✗ 'rate>=0.95' rate=89.79%

    http_req_duration
    ✗ 'p(95)<500' p(95)=3.82s

    http_req_failed
    ✗ 'rate<0.01' rate=10.20%

  █ TOTAL RESULTS

    checks_total.......................: 1649228 18316.01633/s
    checks_succeeded...................: 89.79%  1480978 out of 1649228
    checks_failed......................: 10.20%  168250 out of 1649228

    ✗ status is 200
      ↳  89% — ✓ 740489 / ✗ 84125
    ✗ body contains expected content
      ↳  89% — ✓ 740489 / ✗ 84125

    HTTP
    http_req_duration.......................................................: avg=1.72s min=0s      med=1.73s max=30.09s p(90)=3.32s p(95)=3.82s
      { expected_response:true }............................................: avg=1.91s min=4.27ms  med=1.81s max=30.09s p(90)=3.42s p(95)=3.86s
    http_req_failed.........................................................: 10.20%  84125 out of 824614
    http_reqs...............................................................: 824614  9158.008165/s

    EXECUTION
    dropped_iterations......................................................: 1154367 12820.183033/s
    iteration_duration......................................................: avg=1.81s min=14.05ms med=1.81s max=30.09s p(90)=3.4s  p(95)=3.9s
    iterations..............................................................: 824614  9158.008165/s
    vus.....................................................................: 1       min=1               max=29297
    vus_max.................................................................: 29354   min=2620            max=29354

    NETWORK
    data_received...........................................................: 231 MB  2.6 MB/s
    data_sent...............................................................: 95 MB   1.1 MB/s
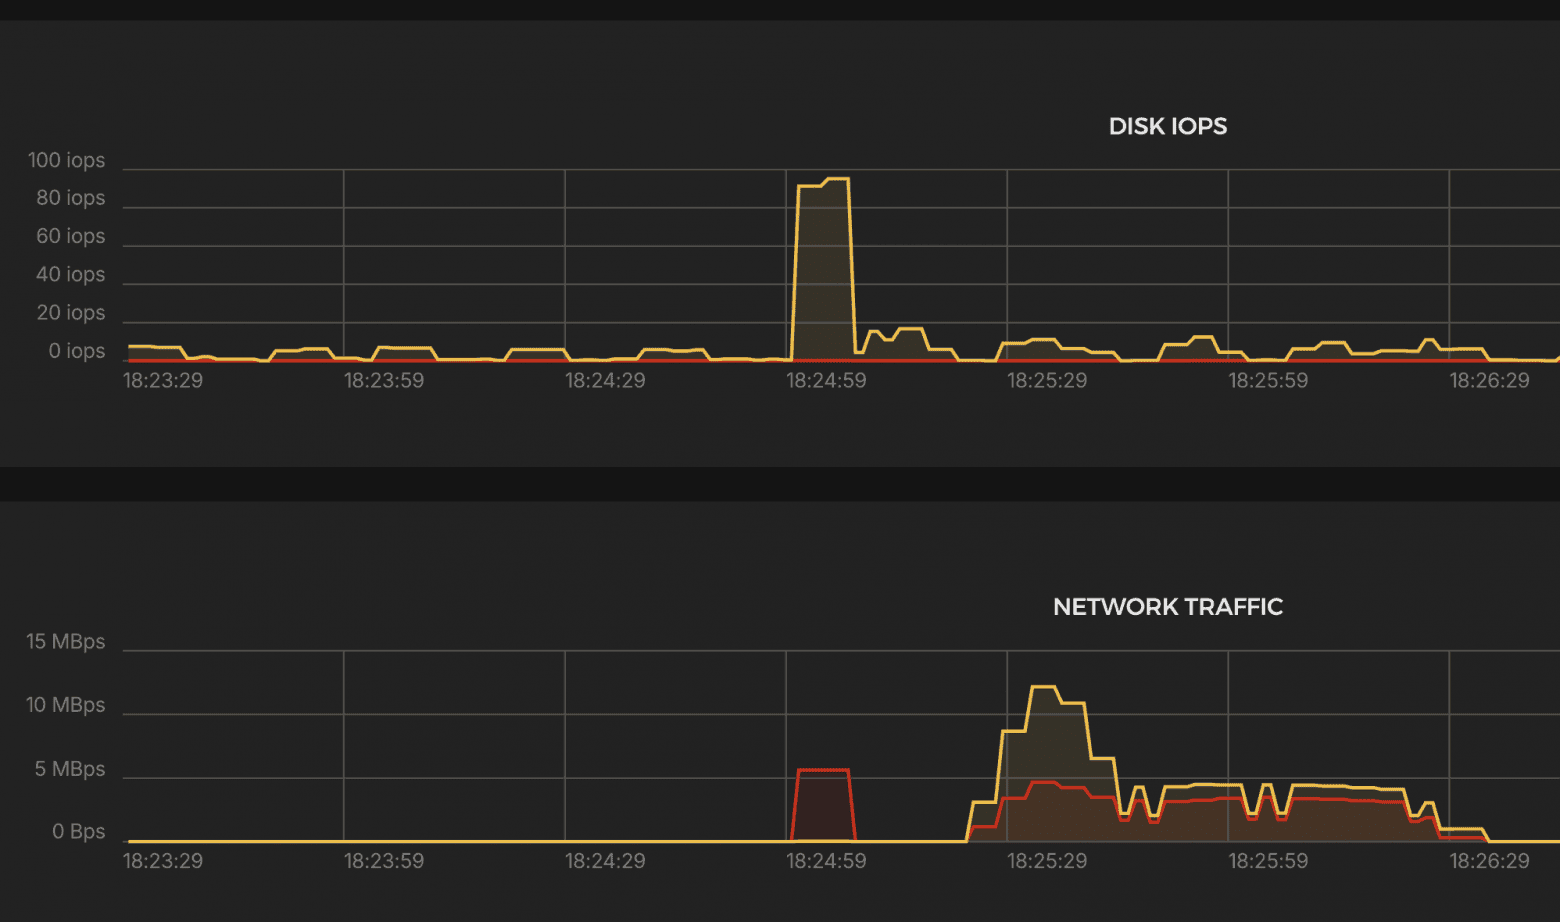
System load
Results:
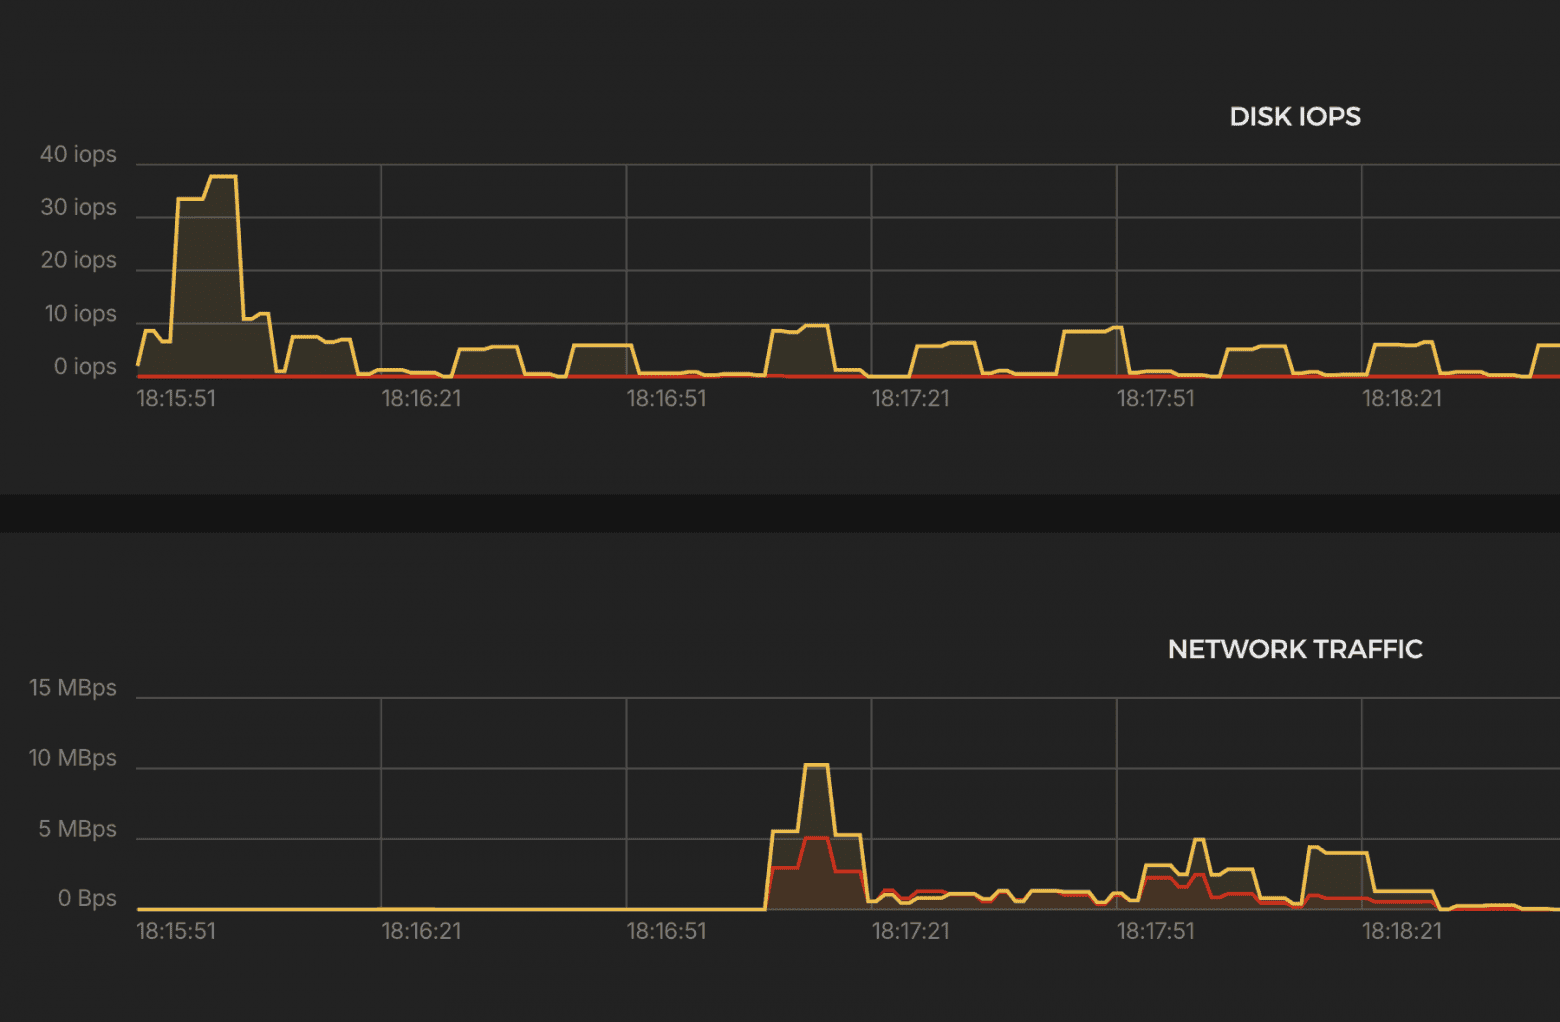
CPU
- ~3000% → ~30 cores engaged.
Network Traffic
- Traffic is more stable than Traefik, but lower than Envoy.
K6 Test Summary
- Successful RPS: 9,158 / sec (x2 higher than Traefik, but still below target)
- Errors: 10.2% (http_req_failed)
- Drops: 1,154,367 iterations
- p(95) latency: 3.82 sec, median 1.73 sec
- Max. delay: 30 sec (timeout)
- Transferred: Received: 231 MB (2.6 MB/s) Sent: 95 MB (1.1 MB/s)
- VUs: up to 29,354 → high load at Traefik level
Verdict:
- Better than Traefik, but far behind HAProxy and Envoy.
- Timeouts and dropped requests still present.
Caddy
It is a modern web server and reverse proxy with native support for HTTPS and automatic certificate retrieval from Let's Encrypt. Caddy's main advantages are ease of configuration, automatic TLS management, and minimal maintenance effort.
docker-compose.yml
- Launch via Docker Compose — container launch with convenient lifecycle management.
- Ports 80 and 443 are open (including 443/udp for HTTP/3).
- Caddyfile is used — a minimalistic and readable configuration.
services:
  caddy:
    image: caddy:latest
    container_name: caddy
    hostname: caddy
    ports:
      - "80:80"
      - "443:443"
      - "443:443/udp"
    restart: unless-stopped
    volumes:
      - caddy_data:/data
      - caddy_config:/config
      - ./Caddyfile:/etc/caddy/Caddyfile
    logging:
      driver: "json-file"
      options:
        max-size: "200k"
        max-file: "10"
    cap_add:
      - NET_ADMIN

volumes:
  caddy_data:
  caddy_config:
Caddyfile
- Caddy automatically retrieves and updates Let's Encrypt certificates without additional scripts or settings.
- Logging is set to ERROR level for minimal disk load.
- Proxying requests to the backend service at http://10.0.0.4:8080.
test-backend.mish.design {
    log {
      level ERROR
    }

    reverse_proxy http://10.0.0.4:8080
}
Run the script
scenarios: (100.00%) 1 scenario, 100000 max VUs, 1m30s max duration (incl. graceful stop):
         * constant_request_rate: 50000.00 iterations/s for 1m0s (maxVUs: 1000-100000, gracefulStop: 30s)

  █ THRESHOLDS

    checks
    ✗ 'rate>=0.95' rate=64.12%

    http_req_duration
    ✗ 'p(95)<500' p(95)=17.03s

    http_req_failed
    ✗ 'rate<0.01' rate=35.87%

  █ TOTAL RESULTS

    checks_total.......................: 603996 6708.595341/s
    checks_succeeded...................: 64.12% 387296 out of 603996
    checks_failed......................: 35.87% 216700 out of 603996

    ✗ status is 200
      ↳  64% — ✓ 193648 / ✗ 108350
    ✗ body contains expected content
      ↳  64% — ✓ 193648 / ✗ 108350

    HTTP
    http_req_duration.......................................................: avg=4.29s min=0s       med=377.57ms max=34.92s p(90)=12.88s p(95)=17.03s
      { expected_response:true }............................................: avg=5.03s min=917.98µs med=2.73s    max=31.94s p(90)=12.95s p(95)=16.93s
    http_req_failed.........................................................: 35.87%  108350 out of 301998
    http_reqs...............................................................: 301998  3354.29767/s

    EXECUTION
    dropped_iterations......................................................: 1861627 20677.127362/s
    iteration_duration......................................................: avg=5.14s min=999.47µs med=477.38ms max=56.43s p(90)=16.17s p(95)=19.59s
    iterations..............................................................: 301998  3354.29767/s
    vus.....................................................................: 1       min=1                max=28943
    vus_max.................................................................: 29170   min=2432             max=29170

    NETWORK
    data_received...........................................................: 104 MB  1.2 MB/s
    data_sent...............................................................: 23 MB   250 kB/s
System load
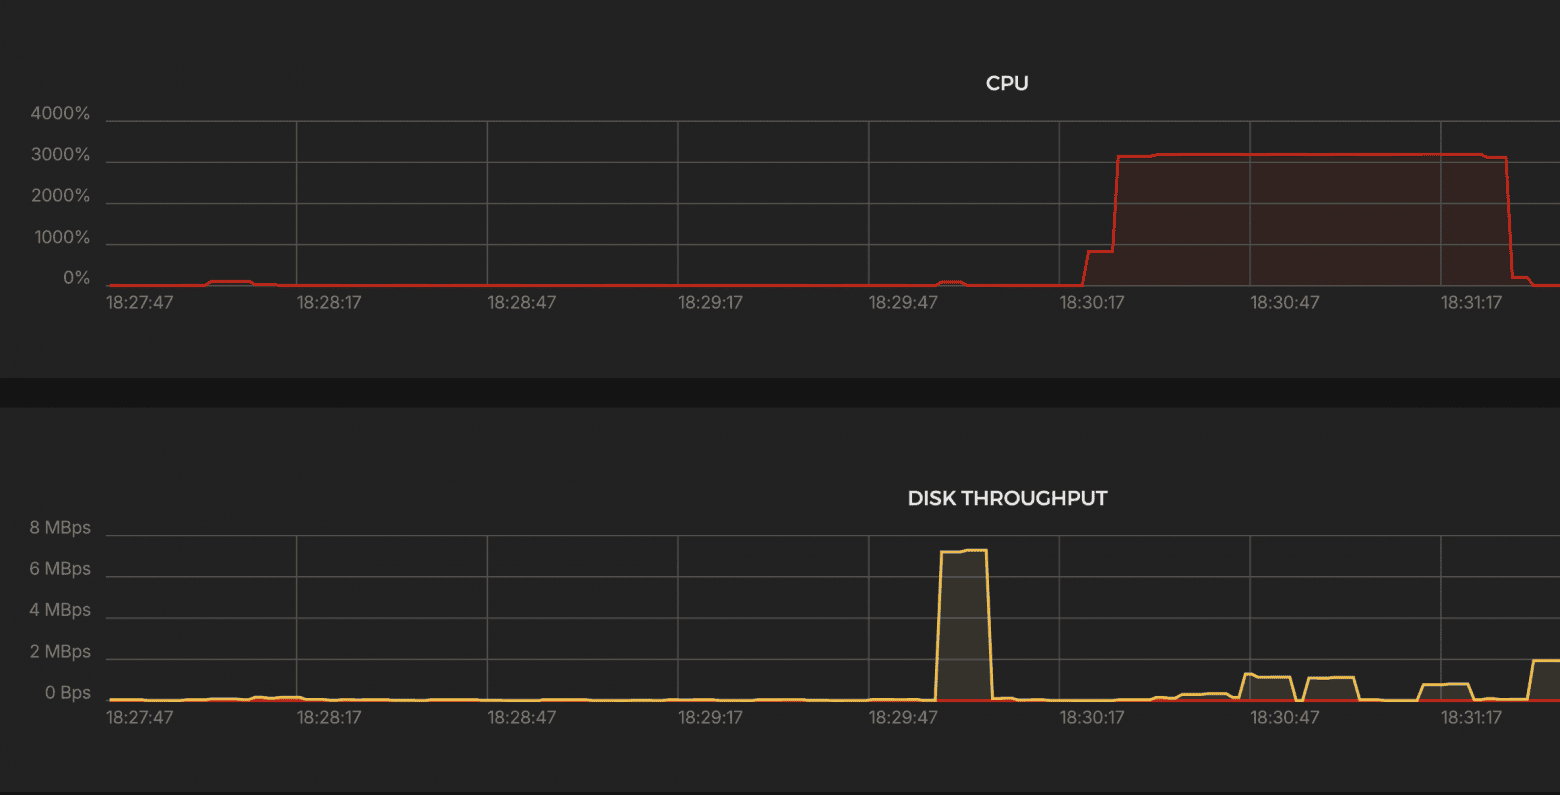
Results:
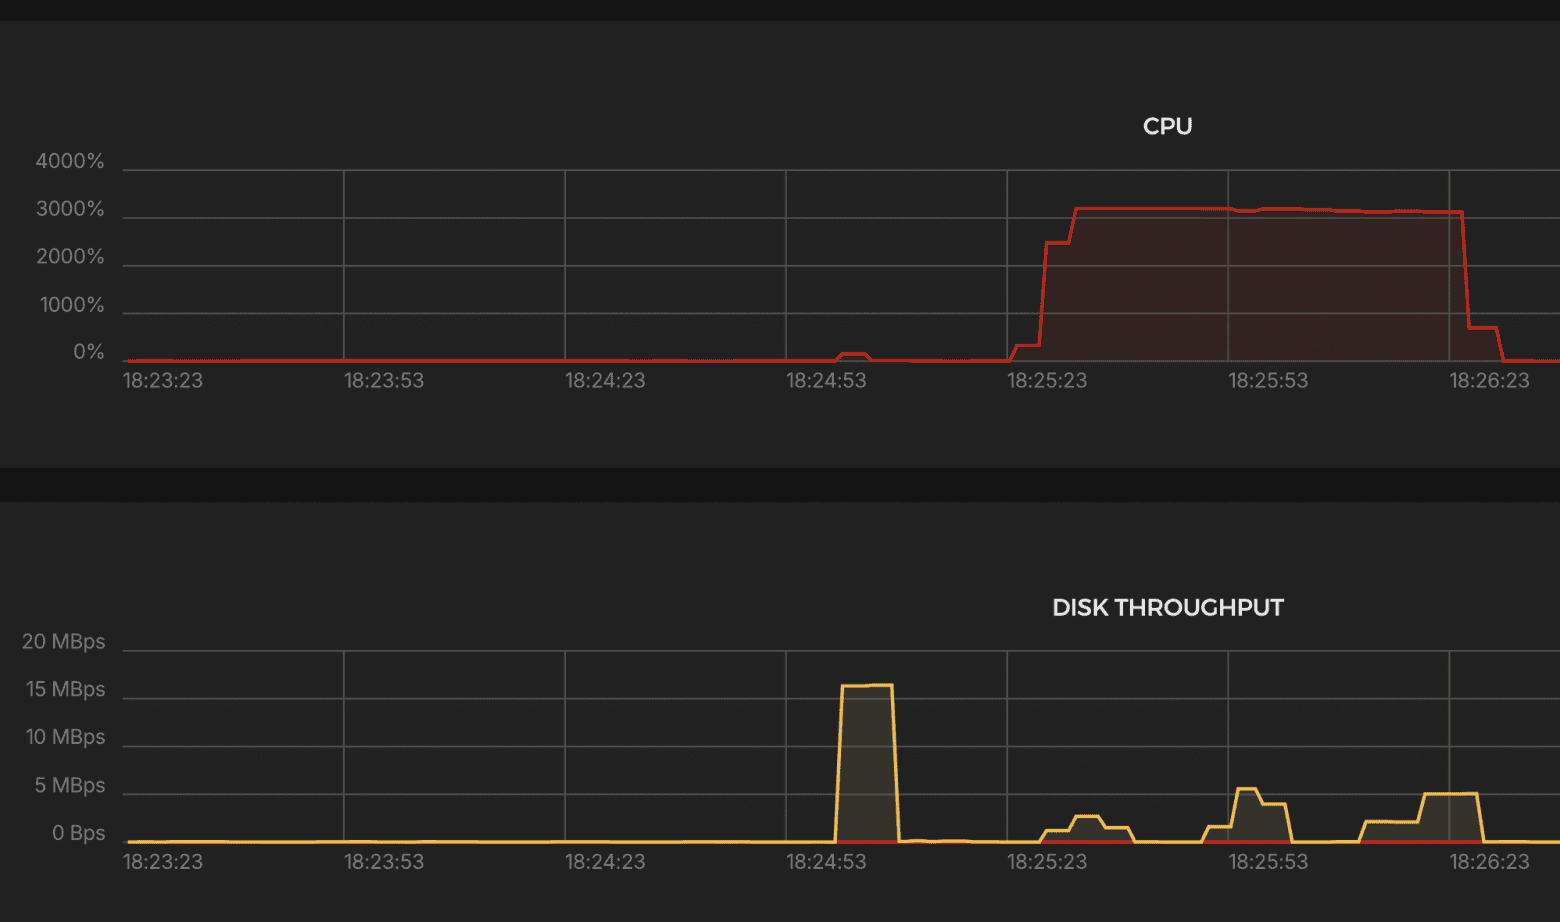
CPU
- ~3000% → ~30 cores engaged.
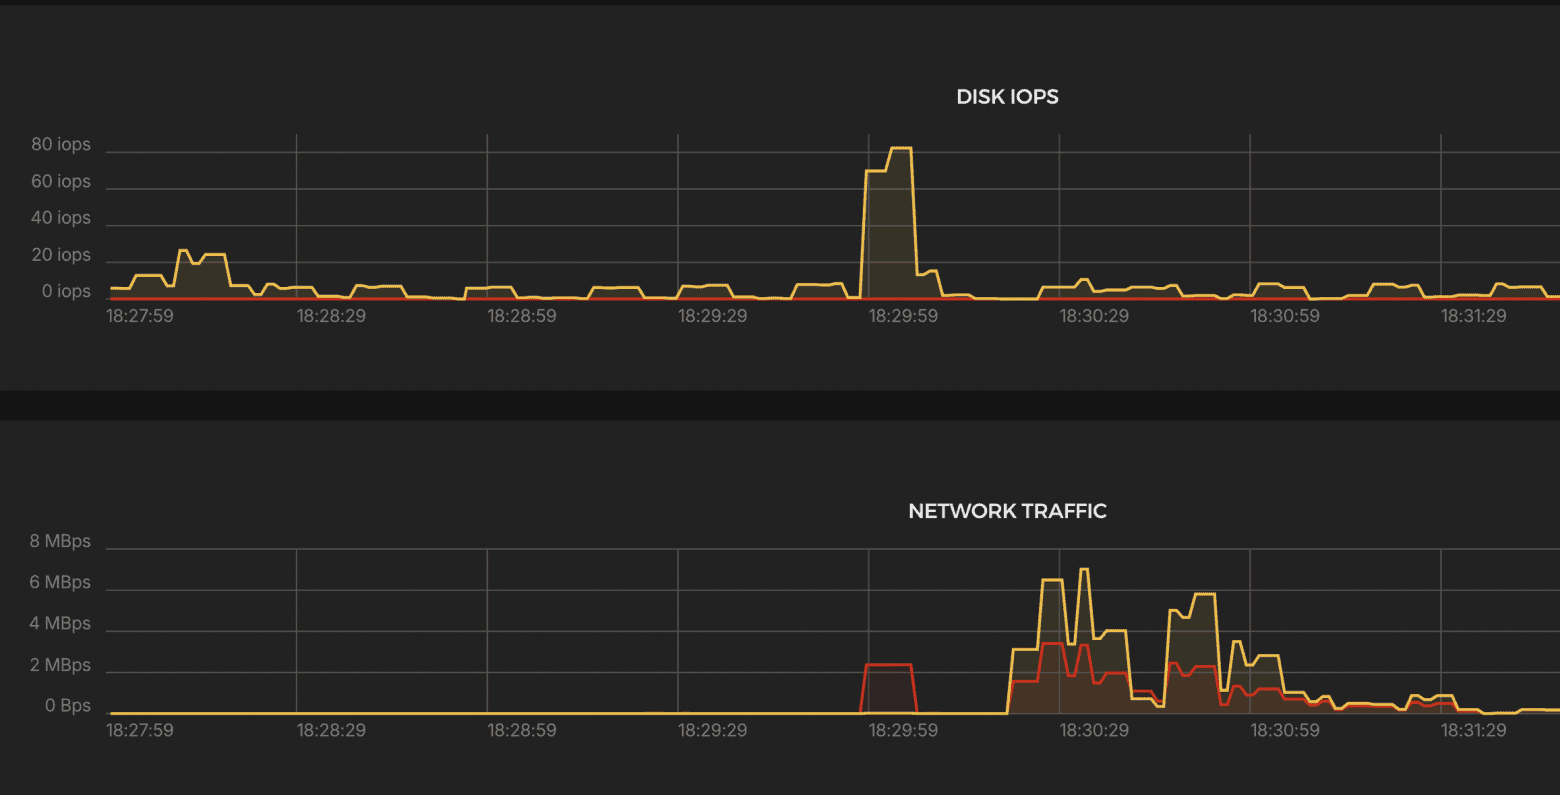
Network Traffic
- Peak incoming traffic: ~6–7 MBps, outgoing: ~3–4 MBps
- Fluctuations are present, especially at the beginning — errors or unstable performance are possible.
K6 Test Summary
- Successful RPS: 3,354 / sec → 15 times lower than target
- Errors: 35.87% (http_req_failed)
- Drops: 1,861,627 iterations
- p(95) latency: 17.03 sec (!), median ≈0.4 sec
- Max. delay: 34.92 sec
- Traffic: Received: 104 MB (1.2 MB/s) Sent: 23 MB (250 KB/s)
- VUs: up to 29,170 — almost at the limit
Verdict:
- Caddy cannot handle a load of 50k RPS.
- High percentage of errors, drops, and delays.
- Performs worse than NGINX and Traefik, closer to an anti-record.
Summary
HAProxy — leader in stability
- The clear leader in test results: consistently maintains 50,000 rps with minimal CPU load. Easy to launch and configure.
Envoy — almost on par with HAProxyy
- Higher CPU load, but acceptable. Convenient in scenarios where flexible routing settings are required.
NGINX — average
- Requires fine-tuning or a different operating mode
- Throughput is 5 times lower than expected
- Abnormal CPU load
Traefik — unstable/p>
- Almost 33% errors, severe drops, p95 = 8.5 sec.
- Throughput is 5 times lower than expected
- Abnormal CPU load
Caddy — worst result
- Highest latency (p95 = 17 sec), 36% errors, >1.8 million drops.
- Abnormal CPU load
- Clearly cannot handle such a load in the default configuration.
Key Takeaways
- HAProxy and Envoy are the top choices for production-grade, high-load environments. Fast, reliable, minimal setup — they just work.
- Traefik, Nginx, and Caddy are fine for smaller projects, but need optimization for heavy traffic.
Who is it suitable for and why use it?
When to use HAProxy or Envoy
- When you need a stable and efficient load balancer “here and now.”
- Minimal configuration effort — just launch it and it works.
When t consider Traefik / NGINX / Caddy:
- For small and medium-sized projects where the load is lower and you can afford a slightly more complex configuration or refinement.
- If your team has someone who knows how to configure and optimize these tools for specific tasks.
Update
Additional NGINX tests requested in the comments
Test #1
keepalive 4; Without multi_accept
worker_processes auto;
worker_rlimit_nofile 300000;

events {
    worker_connections 5000;
    use epoll;
}

http {
  upstream backend {
    server 10.0.0.4:8080;
    keepalive 4;
  }
  server {
    listen 443 ssl;
    server_name test-backend.mish.design;

    ssl_certificate /etc/letsencrypt/live/test-backend.mish.design/fullchain.pem;
    ssl_certificate_key /etc/letsencrypt/live/test-backend.mish.design/privkey.pem;

    location / {
        proxy_pass http://backend;
        proxy_set_header Connection '';
        proxy_http_version 1.1;
        proxy_set_header Host $host;
        proxy_set_header X-Real-IP $remote_addr;
        proxy_set_header X-Forwarded-For $proxy_add_x_forwarded_for;
        proxy_set_header X-Forwarded-Proto $scheme;
    }
  }
}
█ THRESHOLDS

    checks
    ✗ 'rate>=0.95' rate=30.91%

    http_req_duration
    ✗ 'p(95)<500' p(95)=1.11s

    http_req_failed
    ✗ 'rate<0.01' rate=69.08%


  █ TOTAL RESULTS

    checks_total.......................: 1012194 11241.972175/s
    checks_succeeded...................: 30.91%  312910 out of 1012194
    checks_failed......................: 69.08%  699284 out of 1012194

    ✗ status is 200
      ↳  30% — ✓ 156455 / ✗ 349642
    ✗ body contains expected content
      ↳  30% — ✓ 156455 / ✗ 349642

    HTTP
    http_req_duration.......................................................: avg=482.88ms min=0s       med=541.38ms max=2.64s p(90)=1s    p(95)=1.11s
      { expected_response:true }............................................: avg=308.14ms min=448.5µs  med=26.44ms  max=2.64s p(90)=1.19s p(95)=1.45s
    http_req_failed.........................................................: 69.08%  349642 out of 506097
    http_reqs...............................................................: 506097  5620.986087/s

    EXECUTION
    dropped_iterations......................................................: 1780766 19778.147096/s
    iteration_duration......................................................: avg=3.13s    min=495.19µs med=658.68ms max=1m0s  p(90)=1.37s p(95)=30s
    iterations..............................................................: 506097  5620.986087/s
    vus.....................................................................: 13      min=13               max=29174
    vus_max.................................................................: 29266   min=1504             max=29266

    NETWORK
    data_received...........................................................: 179 MB  2.0 MB/s
    data_sent...............................................................: 56 MB   624 kB/s
Test #2
keepalive 4; With multi_accept
worker_processes auto;
worker_rlimit_nofile 300000;

events {
    worker_connections 5000;
    use epoll;
    multi_accept on;
}

http {
  upstream backend {
    server 10.0.0.4:8080;
    keepalive 4;
  }
  server {
    listen 443 ssl;
    server_name test-backend.mish.design;

    ssl_certificate /etc/letsencrypt/live/test-backend.mish.design/fullchain.pem;
    ssl_certificate_key /etc/letsencrypt/live/test-backend.mish.design/privkey.pem;

    location / {
        proxy_pass http://backend;
        proxy_set_header Connection '';
        proxy_http_version 1.1;
        proxy_set_header Host $host;
        proxy_set_header X-Real-IP $remote_addr;
        proxy_set_header X-Forwarded-For $proxy_add_x_forwarded_for;
        proxy_set_header X-Forwarded-Proto $scheme;
    }
  }
}
█ THRESHOLDS

    checks
    ✗ 'rate>=0.95' rate=25.90%

    http_req_duration
    ✗ 'p(95)<500' p(95)=9.14s

    http_req_failed
    ✗ 'rate<0.01' rate=74.09%


  █ TOTAL RESULTS

    checks_total.......................: 944528 13781.245473/s
    checks_succeeded...................: 25.90% 244664 out of 944528
    checks_failed......................: 74.09% 699864 out of 944528

    ✗ status is 200
      ↳  25% — ✓ 122332 / ✗ 349932
    ✗ body contains expected content
      ↳  25% — ✓ 122332 / ✗ 349932

    HTTP
    http_req_duration.......................................................: avg=3.1s  min=0s       med=2.85s   max=20.66s p(90)=7.18s p(95)=9.14s
      { expected_response:true }............................................: avg=1.37s min=462.33µs med=26.11ms max=20.66s p(90)=6.27s p(95)=8.41s
    http_req_failed.........................................................: 74.09%  349932 out of 472264
    http_reqs...............................................................: 472264  6890.622736/s

    EXECUTION
    dropped_iterations......................................................: 1642833 23969.94567/s
    iteration_duration......................................................: avg=3.28s min=504.69µs med=3.01s   max=21.41s p(90)=7.37s p(95)=9.31s
    iterations..............................................................: 472264  6890.622736/s
    vus.....................................................................: 376     min=376              max=29063
    vus_max.................................................................: 29248   min=1490             max=29248

    NETWORK
    data_received...........................................................: 200 MB  2.9 MB/s
    data_sent...............................................................: 55 MB   797 kB/s
Test #3
Original configuration + SSL tuning
worker_processes auto;
worker_rlimit_nofile 300000;

events {
    worker_connections 5000;
    multi_accept on;
    use epoll;
}

http {
  server {
    listen 443 ssl;
    server_name test-backend.mish.design;

    ssl_certificate /etc/letsencrypt/live/test-backend.mish.design/fullchain.pem;
    ssl_certificate_key /etc/letsencrypt/live/test-backend.mish.design/privkey.pem;

    ssl_ciphers 'TLS_AES_128_GCM_SHA256:ECDHE-RSA-AES128-GCM-SHA256';
    ssl_protocols TLSv1.2 TLSv1.3;
    ssl_prefer_server_ciphers on;

    location / {
        proxy_pass http://10.0.0.4:8080;
        proxy_set_header Host $host;
        proxy_set_header X-Real-IP $remote_addr;
        proxy_set_header X-Forwarded-For $proxy_add_x_forwarded_for;
        proxy_set_header X-Forwarded-Proto $scheme;
    }
  }
}
 █ THRESHOLDS

    checks
    ✗ 'rate>=0.95' rate=90.23%

    http_req_duration
    ✗ 'p(95)<500' p(95)=3.97s

    http_req_failed
    ✗ 'rate<0.01' rate=9.76%


  █ TOTAL RESULTS

    checks_total.......................: 1719696 24413.0758/s
    checks_succeeded...................: 90.23%  1551846 out of 1719696
    checks_failed......................: 9.76%   167850 out of 1719696

    ✗ status is 200
      ↳  90% — ✓ 775923 / ✗ 83925
    ✗ body contains expected content
      ↳  90% — ✓ 775923 / ✗ 83925

    HTTP
    http_req_duration.......................................................: avg=1.49s min=0s      med=1.29s max=1m0s   p(90)=3.12s p(95)=3.97s
      { expected_response:true }............................................: avg=1.65s min=4.09ms  med=1.42s max=22.06s p(90)=3.26s p(95)=4.06s
    http_req_failed.........................................................: 9.76%   83925 out of 859848
    http_reqs...............................................................: 859848  12206.5379/s

    EXECUTION
    dropped_iterations......................................................: 1921167 27273.189911/s
    iteration_duration......................................................: avg=1.56s min=13.02ms med=1.35s max=1m0s   p(90)=3.18s p(95)=4.03s
    iterations..............................................................: 859848  12206.5379/s
    vus.....................................................................: 1       min=1               max=28502
    vus_max.................................................................: 28789   min=2785            max=28789

    NETWORK
    data_received...........................................................: 239 MB  3.4 MB/s
    data_sent...............................................................: 100 MB  1.4 MB/s
Thank you for reading to the end ;-)

More articles
Next article
How to Choose the Right Respondent for Digital Research
Research, data analysis, processing results, and integrating insights into workflows — all of it can turn into a waste of time and money if you start with the wrong respondents. So how do you make the right choice? Who should you talk to, when, and how do you build rapport? Let’s figure it out together with Mish’s research experts.

